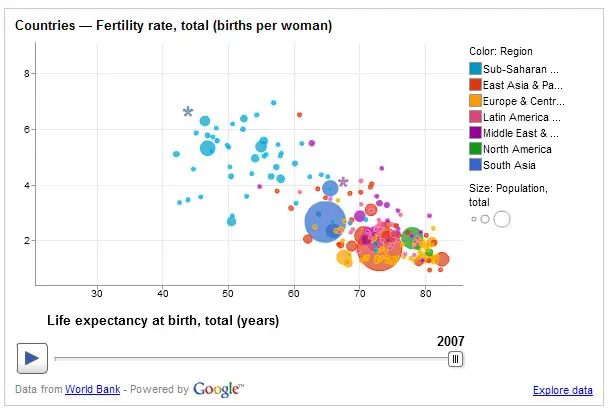
Not so long ago, Google started experimenting on public data search feature that lets users find useful statistics while searching for information. This has been expanded later on to include World Bank statistics including population and demographics data on a global scale. Now, Google is expanding this service by launching the Google Public Data Explorer.
Google Public Data Explorer is an experimental visualization tool that is being released under Google Labs. It lets you easily explore, visualize and communicate large datasets through animated charts and maps. What’s good about the Public Data Explorer is the fact that it makes all these happen easily and without requiring data expertise to view meaningful and rich statistical data sets. And the datasets updates automatically through time.
Once you’ve mashed-up enough datasets, the Google Public Data Explorer makes it easy for you to share them by embedding it on your website or blog.
Now here’s the exciting part. Once you’ve embedded a statistical graph on your website or blog, your users can click on a play button and watch the graphs changes in real-time.
Google Public Data Explorer currently culls data sets from various sources such as the World Bank, U.S. Bureau of Labor Statistics and the U.S. Census Bureau, OECD, U.S. Bureau of Economic Analysis, California Department of Education, Eurostat and more.
Google Public Data Explorer is a pretty useful tool if you’re working in development projects or research. It’s your alternative to the costly proprietary statistical databases being offered by commercial vendors.
You may want to check out the Google Public Data Explorer and see if you can make use of it.
